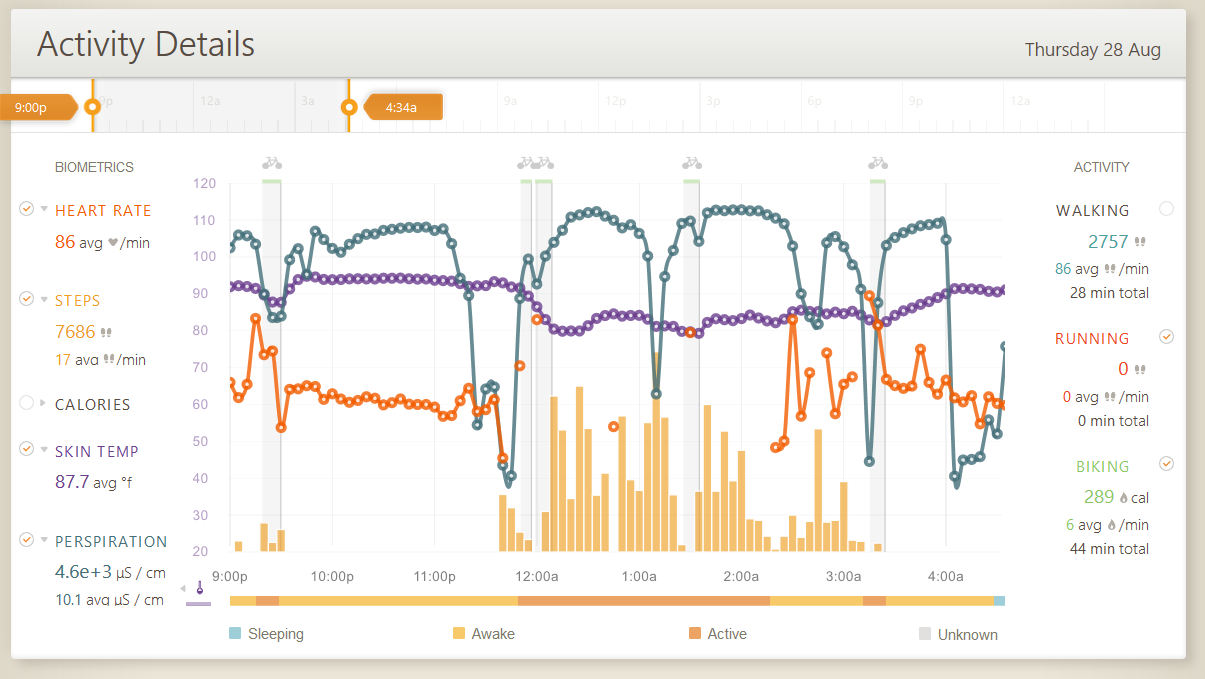
The image above shows the day before the man burned. I slept up to the time that is not visible in this image before setting out on my own for the night to explore the art, music, and watch the piece Embrace burn in the morning. After experiencing the music, and observing the art I made my way to the Souk where I took a quick cat nap. Later than day I got caught in some wicked dust storms, and decided to wait them out. The time frame after this period was spent sleeping.
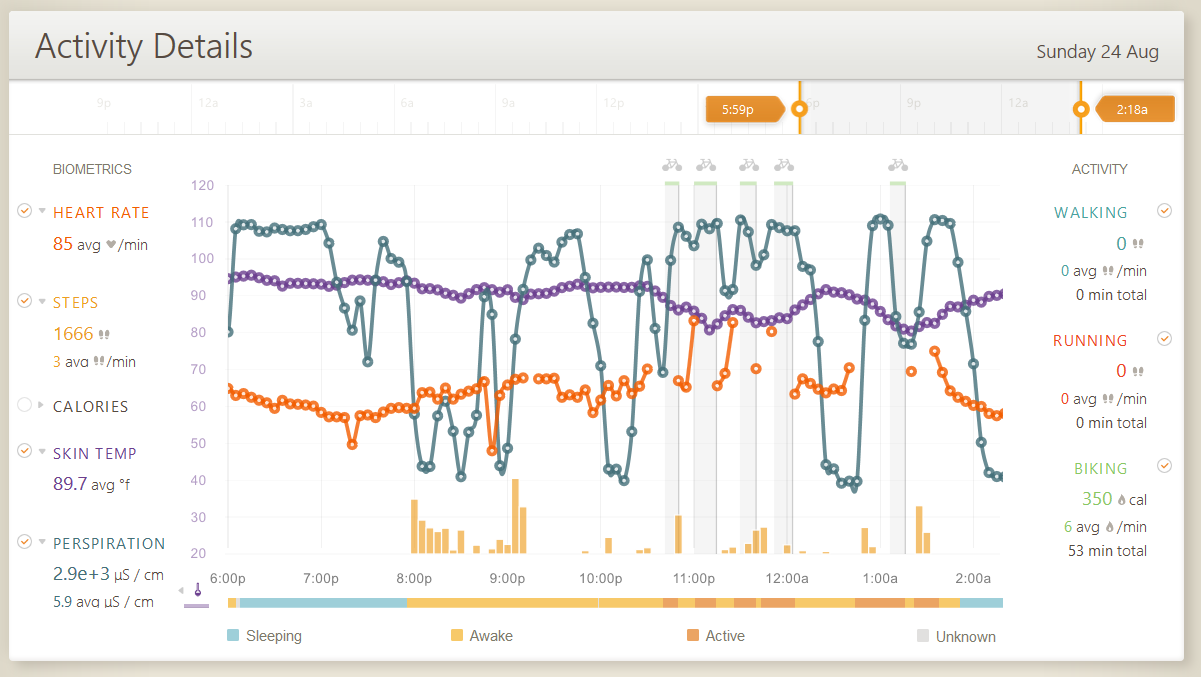
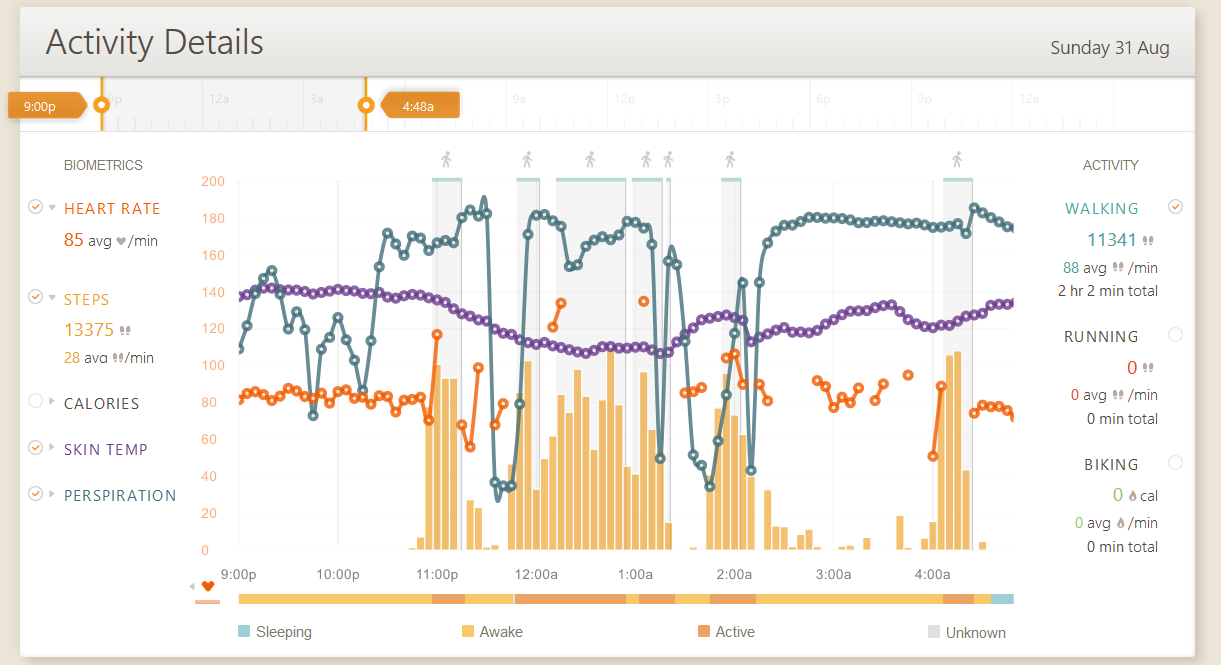
This was the most archetypal evening that I could find; the opening night of the Souk! I was exhausted, but after a quick nap and some dinner I was off to work for the evening! For half of my “shift” I was very active and on my feet, while the second half of my shift was spent more sitting around pushing swag and instructions into people hands.
My coworker noticed the correlation between my skin temperature and perspiration levels, what the data does not show is that I reduced the amount of layers I was wearing as well. This night I danced the hardest out of the whole week. And interesting phenomenon in the data was how the Basis fitness tracker counted the number of steps I was taking while dancing.
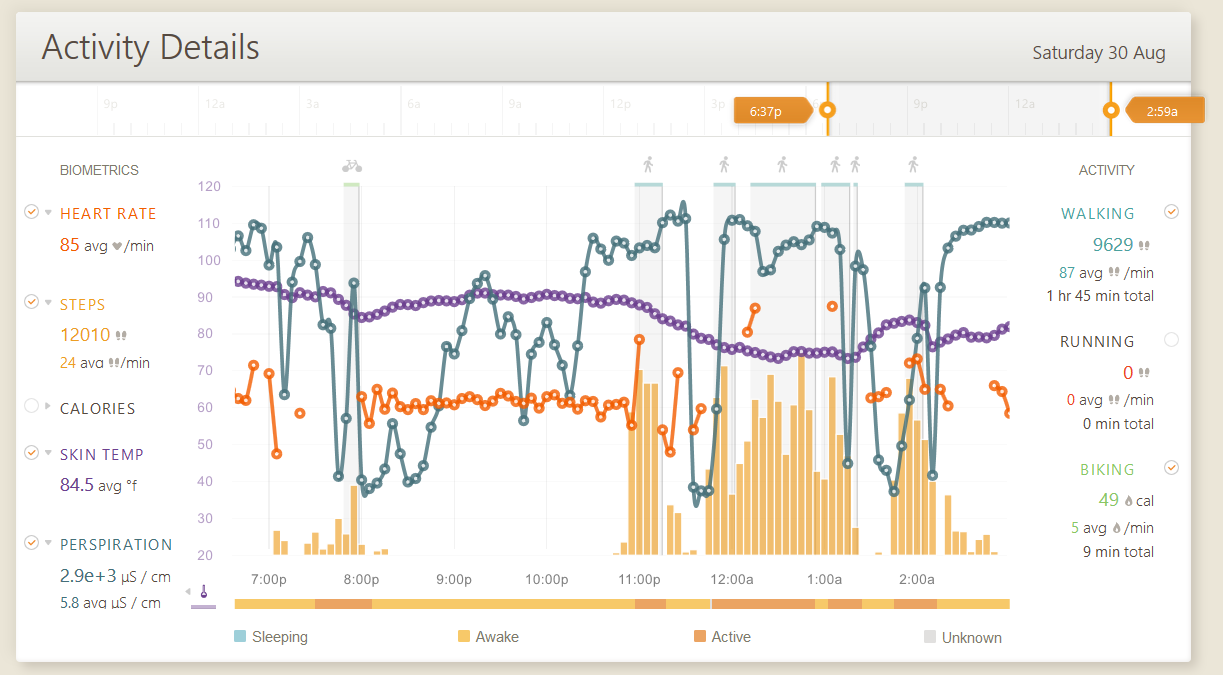
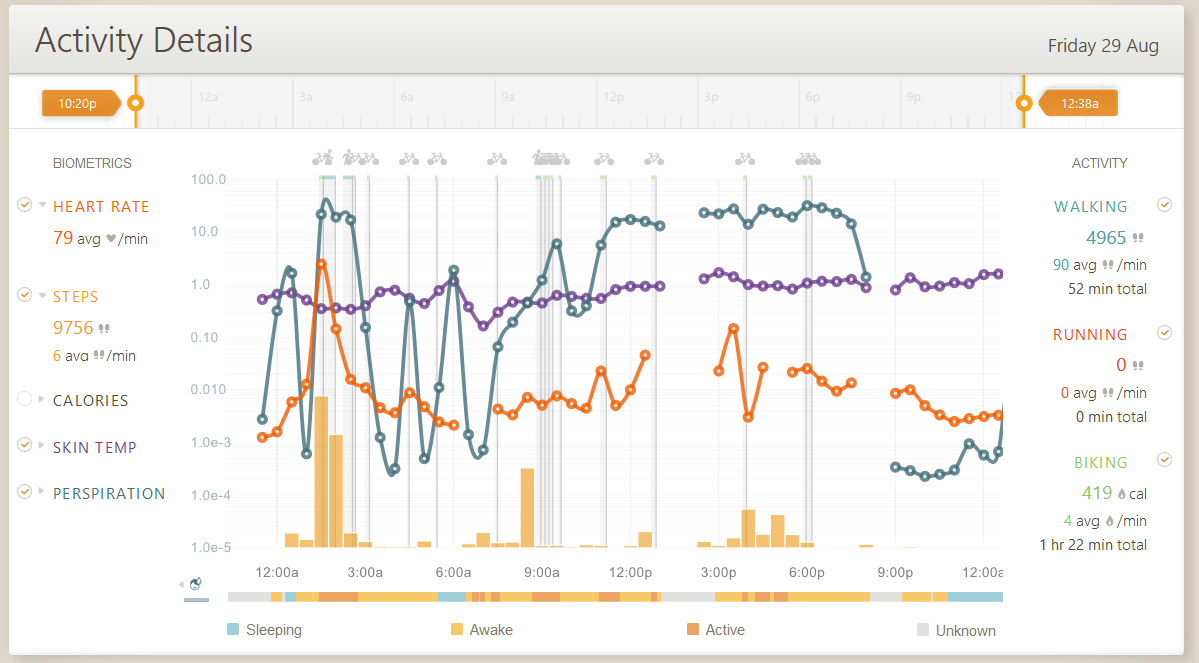
On the night of the burn I rode my bike to where the local Fire Conclave was performing and sat down in anticipation of the burn. 2-hours later the perimeter broke and my bike was no where to be found. The awesome thing about the data is that at 8:28 is when the man started to burn, the same time as when my perspiration levels increased. When the man finally fell, so did my perspiration levels. This was the first time I had a bike “stolen”, which made for a great adventure of just trying to locate the bike, but alas it was gone along with the outer layer I had planned to keep me warm. Luckily I had an emergency Mylar blanket which is couture fashion on the playa, the way the emergency blanket was used to maintain body head also produced moisture
As mentioned above, I don’t care for the MyBasis.com UI. Mainly because the window of time that the data can be viewed upon is limited to 30 hours. This makes it harder to see the forest from the trees, in the sense that I cannot see the data from the entire 11 days I was in the desert. Sure the watch ran low on memory and I lost the first two days of data, but for the remaining 9 days worth of data the biggest limitation is the fact that the stories can only be told in the form if chapters or tales.
Scraping the data is trivial, albeit the issue of modeling a complex data set such as this is not the easiest. Digging into the undocumented API myself using the browsers developer tools to find the biggest JSON that was being returned and playing with the request variables. Ssummary=false is non functional; the summary object return null values when this parameter is set to true or false. Interval=60 accepts a range between 1 and 3600; the interval is the period of time in which the parameter supplied will be a number of seconds to pull a sample. For example when interval is set to 60 the data set will contain 1439 elements, when interval=3600 the data set will contain 24 elements. The effects of this parameter on the data returned can cause expected variations in the standard deviation as the sampling window increases. Units=ms is a default value that is optional. Start_date=2014-04-19 will return data from within the 24-hour period of time. The parameters that return all of the individual sensor data are as follows, heartrate=true&steps=true&calories=true&gsr=true&skin_temp=true. Which returns a summary of the days values in the form of min, max, sum, stdev, and average along with the actual values. And then things got harder. Scripting the scraping of the data is not the issue, as much as what to do the droves of data!
To liberate the data from the undocumented API I used the off the shelf solutionBasis Retriever App to export the data as a summary of events. This is the best off the shelf solution for pulling the data from the MyBasis website. This provided me with the high-level information that made for some nice aggregates, but not the actual rich sensor data I was wanting to visualize.
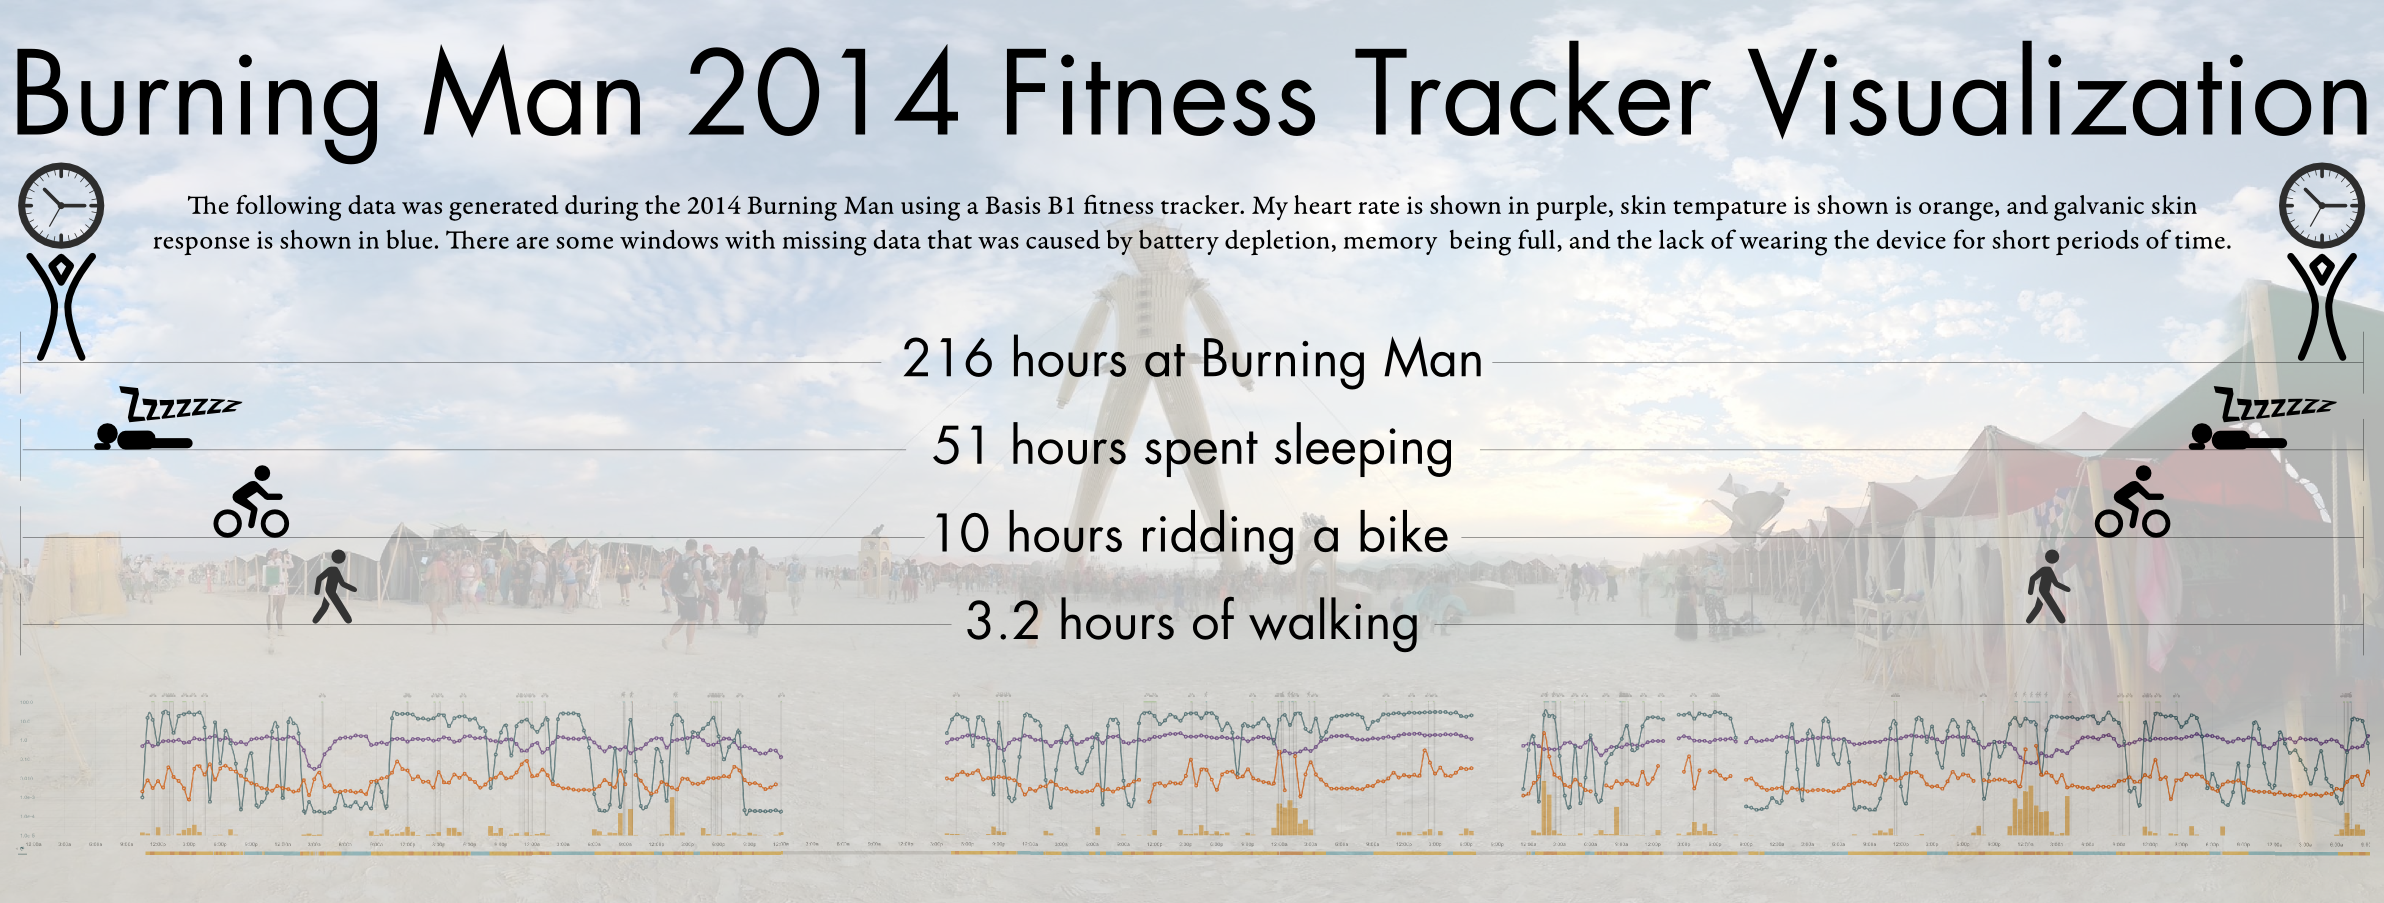
The easiest final product can be seen at the top of this page and below this paragraph. Using screed shots from the MyBasis.com I was able to stitch together what my experiance looked like while providing the most pertinant metrics.