This is a run down of the different tools that I use to monitor server performance. These are not all used simultaneously, rather I need a dashboard or to see at a glance how the server that hosts this site is performing. Sure the 3 dashboards running on the micro instance take up 10% of the RAM, but they are so useful and darn pretty to stare at!
Boundary
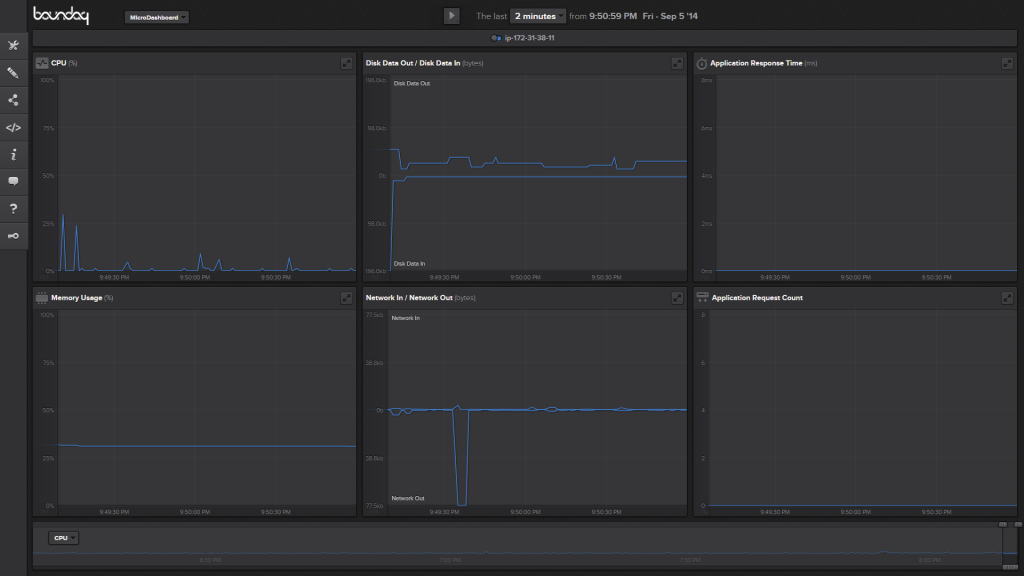
The unique value in the monitoring tool Boundary, is that their resolution is down to one second. This translates into being able to see the issue before it is critical and a customer is calling to complain about an interruption of service. From a visual design stand point I love Boundary; the dark visuals and customizable dashboard makes it stunning.
Boundary Dashboard

New Relic
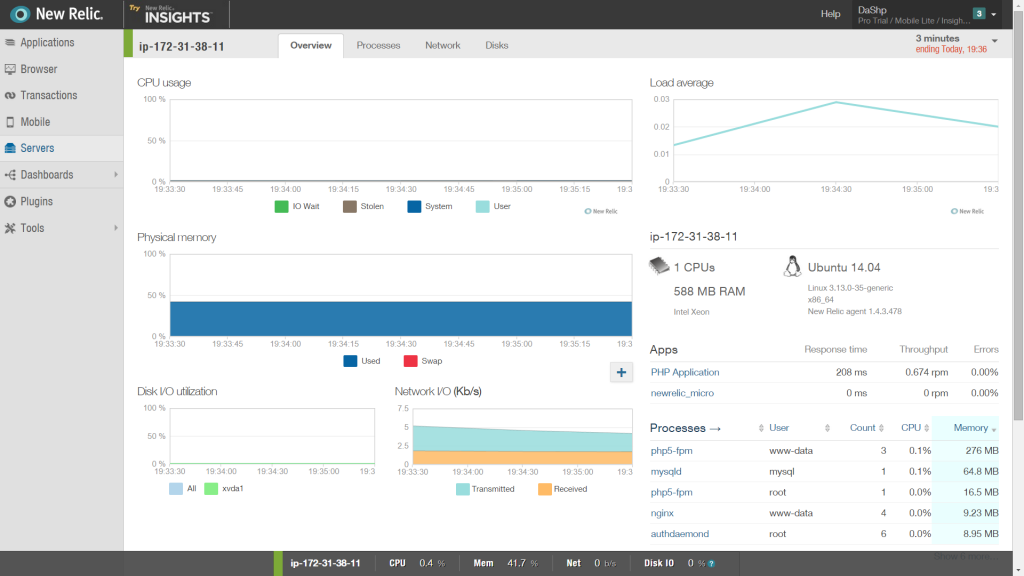
New Relic is capable of showing server and application monitoring in an all inclusive and visually stunning manner. The embarrassment of having a service running as root on your dashboard makes the surfacing of security risks much more enticing to spot.
New Relic Micro Instance Dashboard

Linux Dash
Click here for a Real-time Linux Dashboard for this Site
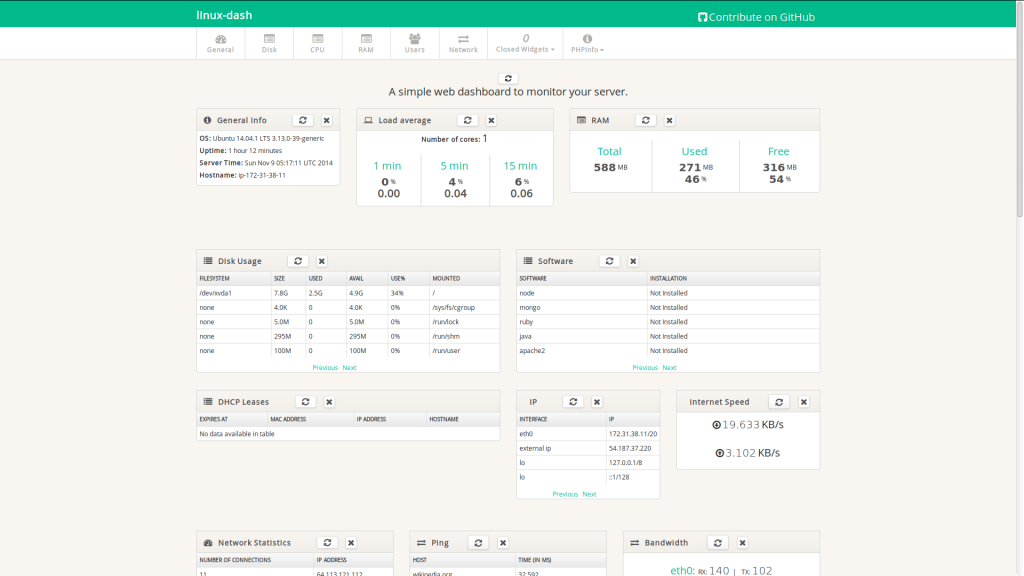
Linux dash is a self hosted solution for monitoring a linux server. This dashboard surfaced itself in a hacker news discussion on what everyone uses to monitor linux server performance. Linux Dash was quickly upvoted to the top of the discussion.

